
The investment question for TSMC in 2026 is no longer whether AI will generate revenue. It is how long the rapid growth driven jointly by AI, advanced nodes, and advanced packaging can last—and how much success is already priced in.
In the second quarter of 2026, TSMC’s U.S. dollar revenue reached US40.2 billion, up 33.7% year over year. HPC contributed 66% of quarterly revenue, and 2nm contributed 3% of wafer revenue for the first time. The company subsequently raised its full-year 2026 U.S. dollar revenue growth outlook to slightly above 40%. At the same time, full-year capital expenditure rose to US60–64 billion, while the rapid 2nm ramp and overseas fabs began to pressure gross margin.
For HIBT users, there is also a product-level issue to address first: the TSM currently traded is not the TSM ADR itself on the New York Stock Exchange, nor should it be confused with the historical TSMON or TSMB. The HIBT announcement labels it as “Taiwan Semiconductor Manufacturing · Robinhood Token,” with the trading pair TSM/USDT and the network Robinhood Chain. What investors receive is stock-linked token exposure on a trading platform. Without legal documents, it should not be directly equated with a TSMC ADR held in a brokerage account.
Investors can check the current price, volume, and order book through TSM real-time quote, but before placing an order, they should also compare the NYSE TSM ADR price and check whether the token has a significant premium or discount.
Risk disclaimer: This article is based on publicly available information as of September 15, 2026, and is intended only for information organization and investment research. It does not constitute investment advice, a return promise, or a trading solicitation. Stock-linked tokens carry underlying equity risk, issuance and custody structure risk, platform risk, on-chain risk, liquidity risk, and regulatory risk.
Key Takeaways: 8 Things to Know Before Investing in TSM
- The long-term value of TSM/USDT comes from TSMC the company, not from an independent crypto ecosystem or tokenomics.
- The current TSM on HIBT is a Robinhood Token and must be verified separately from the historical TSMON and TSMB.
- TSMC expects full-year 2026 U.S. dollar revenue growth of slightly above 40%. AI is already in the financial statements, not just a concept.
- HPC accounted for 66% of second-quarter revenue. TSMC is becoming a purer exposure to AI computing infrastructure.
- 2nm already contributed 3% of wafer revenue, but the early ramp is expected to dilute third-quarter gross margin by about 3–4 percentage points.
- US$60–64 billion in capital expenditure is both a strong demand signal and a source of depreciation, execution, and future oversupply risk.
- Second-quarter net income grew 77.4% year over year, but this included gains from the disposal of VIS shares and mark-to-market gains, so it cannot all be treated as operating growth.
- A good company does not mean any price is worth buying. Final returns depend on earnings growth, valuation, purchase premium/discount, and token product risk.
1. What Is TSM/USDT? Confirm the Product First, Not TSMC’s History
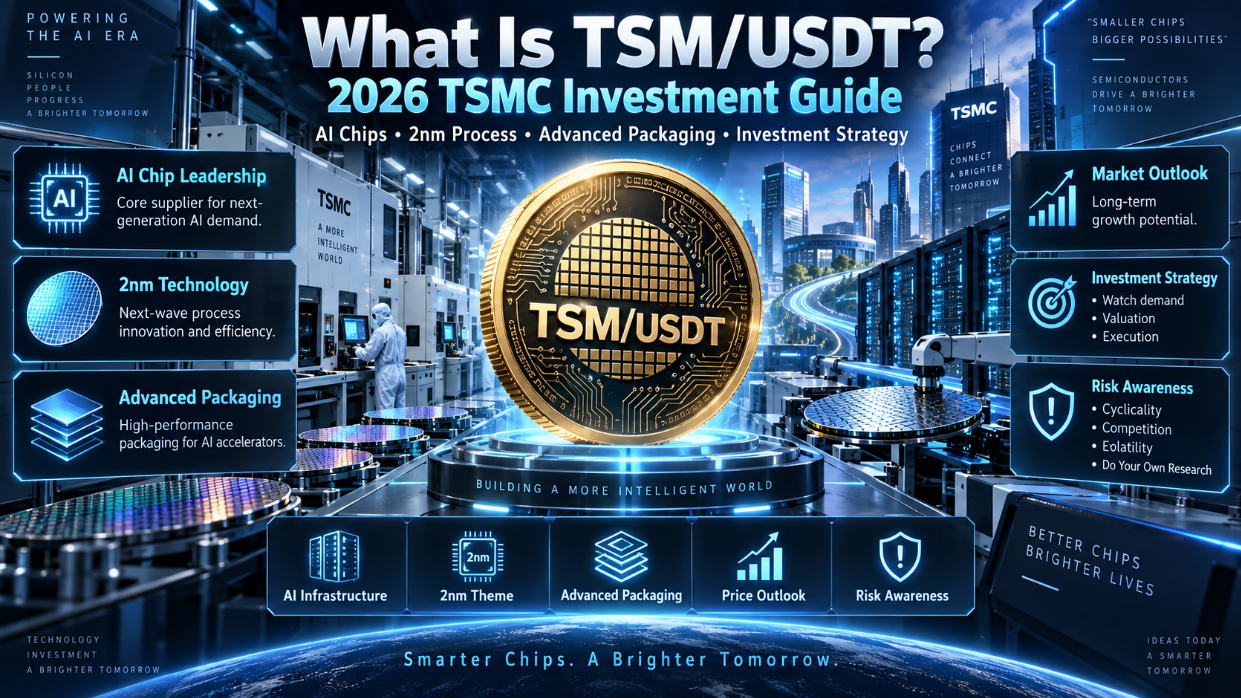
TSM/USDT is a stock-linked token trading pair opened by HIBT on September 15, 2026. According to the HIBT listing announcement, the asset name is Taiwan Semiconductor Manufacturing · Robinhood Token, the network is Robinhood Chain, and the contract address is:
0x58FfE4a942d3885bAa22D7520691F611EF09e7AA
Here, USDT is the quote asset. If TSM/USDT shows 420, it means the market is quoting one TSM Token at about 420 USDT. It does not mean TSMC has issued a new cryptocurrency called TSM.
Understanding this product requires separating three layers:
- The underlying company is Taiwan Semiconductor Manufacturing Company, or TSMC.
- TSM on the New York Stock Exchange is TSMC’s ADR ticker; TSMC’s ordinary shares trade on the Taiwan Stock Exchange under ticker 2330.
- TSM on HIBT is a Robinhood Token, a stock-linked product in an on-chain or crypto trading environment.
Therefore, the correct order for researching TSM/USDT is: first study TSMC’s earnings and TSM ADR valuation, then verify the token issuance structure, price deviation, and liquidity.
2. Does Buying TSM Token Mean Directly Owning TSMC Stock?
Not directly.
The HIBT announcement can confirm the name, trading pair, network, and contract, but the announcement text does not explain how the underlying security is held, who custodies it, whether token holders can redeem the ADR, whether they receive dividends or voting rights, or how bankruptcy remoteness is arranged. Without these product documents, the safest statement is: TSM is a Robinhood Token that tracks the economic value of TSMC stock, not a TSM ADR registered in an investor’s name in a traditional brokerage account.
This distinction affects:
- Legal rights: Price exposure does not necessarily equal shareholder rights.
- Dividend treatment: It depends on whether the issuer reinvests dividends, distributes cash equivalents, or reflects them in the token’s net value.
- Redemption ability: Being tradable does not mean every holder can redeem the underlying ADR 1:1.
- Custody and bankruptcy risk: Who holds the underlying security and whether it is segregated determine the recovery path in extreme situations.
- Regional restrictions: Tokenized securities are often subject to investor eligibility and geographic rules.
Until relevant legal documents are disclosed, one should not claim that “buying TSM means becoming a TSMC shareholder,” nor should one promise 1:1 redemption, voting rights, or dividend rights.
3. What Is the Difference Between TSM, TSMON, and TSMB?
They may reference the same underlying company, but they are not the same tokenized product.
TSMON was the Ondo version of Taiwan Semiconductor Manufacturing Tokenized Stock historically listed on HIBT, and the announcement labeled it an ERC-20 product. TSMB was another historical product under the bStocks system. The current TSM is explicitly labeled by HIBT as a Robinhood Token and is deployed on Robinhood Chain.
The same underlying asset does not mean the same issuer, contract, network, collateral structure, redemption arrangement, or holder rights. To judge authenticity and risk, at minimum check:
- Underlying: Does it track 2330 ordinary shares, TSM ADR, or another reference price?
- Issuer: Who created the product and bears the product obligations?
- Contract: Does the contract address match the official announcement?
- Chain: Is the asset on Robinhood Chain, Ethereum, or another network?
- Collateral: Is it backed by the underlying security, and how?
- Redemption: Who can subscribe or redeem, and what are the windows and fees?
- Rights: How are dividends, voting, and corporate actions handled?
Identifying a product only by the three letters “TSM” makes it easy to buy the wrong asset or misunderstand its rights.
4. How Strong Are TSMC’s 2026 Fundamentals?
According to TSMC’s 2Q26 earnings release, quarterly revenue was NT1.27038 trillion, or US40.2 billion; NT dollar revenue grew 36.0% year over year, and U.S. dollar revenue grew 33.7% year over year.
More noteworthy is that revenue, margins, and advanced nodes strengthened at the same time:
- Gross margin: 67.7%.
- Operating margin: 60.3%.
- Net income: NT$706.56 billion, up 77.4% year over year.
- EPS: NT27.25; US4.31 per ADR.
- 7nm and more advanced nodes accounted for 77% of wafer revenue.
- HPC revenue grew 20% quarter over quarter and accounted for 66% of quarterly revenue.
This shows that AI-related demand has translated into higher capacity utilization, advanced-node mix, and real revenue. TSMC is no longer merely a company that “may benefit from AI”; it is one of the most direct manufacturing beneficiaries of current AI capital expenditure.
However, net income growth cannot be treated entirely as core operating growth. Second-quarter non-operating income was about NT96 billion, of which about NT63.2 billion came from the disposal of Vanguard International Semiconductor (VIS) shares and mark-to-market gains, contributing about NT$2.24 to EPS. When assessing earnings quality, operating margin and normalized EPS excluding one-time items are more useful than the 77.4% headline net income growth rate.
5. With HPC at 66% of Revenue, Has TSMC Become an AI Infrastructure Company?
HPC includes high-performance computing-related chips and should not be entirely equated with generative AI. But a 66% revenue share and 20% quarter-over-quarter growth still show that TSMC’s growth center has clearly shifted from the traditional smartphone cycle toward computing platforms.
TSMC’s AI exposure comes not only from NVIDIA GPUs but also from:
- AMD GPUs and CPUs;
- Cloud service providers’ in-house ASICs, such as training and inference accelerators;
- x86, Arm, and RISC-V CPUs;
- Data center networking chips;
- High-end computing products such as Apple Silicon;
- Advanced packaging paired with AI chips.
TSMC management also noted that Agentic AI is increasing AI data centers’ demand for CPUs again. Regardless of which CPU architecture ultimately wins, many major design companies are TSMC customers. This gives TSMC a kind of “platform-neutral” AI exposure: it does not need to accurately predict which GPU or ASIC vendor wins, and it may still benefit from expansion across the entire computing stack.
The downside risk is equally clear. The higher HPC concentration is, the more sensitive TSMC becomes to hyperscaler capital expenditure, AI chip inventory, and high-end computing demand. If AI investment shifts from acceleration to inventory digestion, both revenue and valuation could come under pressure.
6. What Is TSMC’s Real AI Moat?
Summarizing the moat as “NVIDIA is a customer” is too simplistic. A more complete competitive advantage includes five parts.
First is advanced process technology. 2nm, 3nm, and 5nm determine whether high-performance chips can balance power, speed, and transistor density.
Second is yield. An advanced node in a technical paper is not the same as being able to deliver in stable, high volume. Yield directly affects customer costs and TSMC’s gross margin.
Third is capacity. AI customers need not only performance but also tens of thousands or more chips delivered on schedule.
Fourth is advanced packaging. GPUs, HBM, and interconnect structures need to be integrated using technologies such as CoWoS and SoIC. Front-end wafer manufacturing and back-end packaging are both indispensable.
Fifth is customer trust. The pure-play foundry model reduces direct competition conflicts with fabless customers. TSMC management summarizes its long-term competitive foundation as Technology, Manufacturing, and Customer Trust, which is harder to replicate than any single customer relationship.
7. 2nm Already Contributes 3% of Revenue—Why Is It Both a Growth Opportunity and Margin Pressure?
In second-quarter wafer revenue, 2nm accounted for 3%, 3nm 30%, 5nm 33%, and 7nm 11%. 2nm is no longer a future narrative on a roadmap; it has entered the actual revenue stage.
Long term, 2nm has three layers of value: higher revenue per wafer, revenue expansion from adoption by smartphone and HPC customers, and consolidation of technology leadership. If 2nm’s revenue share rises from 3% to 10% or higher, it could become the core of the next product mix upgrade.
Short term, new nodes typically face lower initial yields, higher depreciation, and equipment and start-up costs during early mass production. In its 2Q26 earnings call, TSMC estimated that the rapid 2nm ramp would dilute third-quarter gross margin by about 3–4 percentage points; the company’s third-quarter gross margin guidance is 65%–67%, below the second quarter’s 67.7%.
So “2nm revenue growth” and “short-term gross margin decline” can both be true. To judge whether the business is deteriorating, look at whether the gross margin decline is in line with the ramp plan, whether yield is improving, and whether customer demand is enough to fill capacity—not just compare headline numbers between two quarters.
8. Why Is CoWoS as Important as Advanced Nodes?
An AI accelerator is not finished after a logic chip is manufactured. A GPU or ASIC also needs high-density, low-latency connections to multiple HBM stacks. CoWoS integrates logic chips, HBM, and an interposer into the same packaging system, while SoIC further serves 3D chip stacking and heterogeneous integration.
The supply chain can be understood as: advanced nodes manufacture the computing core, HBM provides high-bandwidth memory, advanced packaging connects multiple high-value chiplets, and finally a deployable AI server computing module is formed.
This means TSMC may earn not only wafer foundry revenue but also more value from rising packaging complexity. If packaging capacity is insufficient, AI chips cannot be delivered on time even if front-end wafers are abundant. Therefore, CoWoS capacity, lead times, and customer utilization are important indicators for validating AI demand.
9. What Does US$60–64 Billion in CapEx Mean?
TSMC raised its 2026 capital budget to US$60–64 billion. According to company plans, 70%–80% is for advanced nodes, about 10% for specialty nodes, and 10%–20% for advanced packaging, testing, photomasks, and other items.
The bull explanation is that customers are giving very strong multi-year capacity signals, and the company must invest years in advance to meet 2nm, 3nm, and advanced packaging demand. Rising CapEx also reflects management confidence in long-term demand for AI, 5G, and HPC.
The bear explanation is that capital spent today will become depreciation and fixed costs in the future. If AI capital expenditure slows in 2027–2028, customer inventory rises, or competition intensifies, lower capacity utilization could significantly compress gross margin.
Therefore, higher CapEx is not automatically bullish. A more useful tracking method is to monitor at the same time:
- Incremental revenue ÷ incremental CapEx;
- Incremental operating profit ÷ incremental CapEx;
- Advanced-node capacity utilization;
- The gap between free cash flow and CapEx;
- Customer commitments and actual shipments two to three years after new capacity is deployed.
If CapEx keeps rising but revenue growth, utilization, and free cash flow begin to fall, what was originally growth investment may be turning into oversupply risk.
10. Are Overseas Fabs a Moat or a Margin Burden?
Arizona, Japan, and Europe can diversify geographic concentration, move closer to key customers, obtain policy support, and improve supply chain resilience. This can be understood as “geopolitical insurance.”
Insurance is not free. Overseas fabs may be more expensive in construction, labor, supply chain support, and initial utilization. TSMC has clearly stated that overseas fabs diluted second-quarter gross margin; the company expects overseas expansion to dilute gross margin by 2–3 percentage points in the early stage and potentially by 3–4 percentage points later.
Investors should not simply classify overseas expansion as bullish or bearish. The real question is: can higher costs buy more stable customer relationships, policy support, and lower tail risk, and can the company absorb these costs through pricing, yield, and scale?
11. August Revenue Up 53.3% YoY—Will Q3 Beat Again?
TSMC’s monthly revenue shows July revenue of NT467.58 billion, up 44.7% year over year; August revenue of NT514.806 billion, up 53.3% year over year; and cumulative January–August revenue of NT$3.38687 trillion, up 39.3% year over year.
The company’s third-quarter U.S. dollar revenue guidance is US44.6–45.8 billion, with an exchange rate assumption of US1 = NT32. Under that assumption, third-quarter NT dollar revenue would be about NT1.4272–1.4656 trillion.
July and August revenue totaled NT$982.386 billion. Based on this, a “monthly revenue implied threshold” can be established:
- To reach the low end of guidance, September needs about NT$444.814 billion;
- To reach the midpoint of guidance, September needs about NT$464.014 billion;
- To reach the high end of guidance, September needs about NT$483.214 billion.
This is not a company forecast, but an arithmetic estimate by HIBT based on official guidance and already reported monthly revenue. Actual U.S. dollar revenue will also be affected by exchange rates and accounting translation, but it gives investors a more verifiable Q3 tracking framework than simply saying “August growth was very high.”
12. Is TSM Expensive Now? Don’t Look at Just One P/E Number
Valuation must answer questions about growth, earnings quality, and risk premium at the same time.
As of September 14, 2026, the NYSE TSM ADR closed at about US$418. A stock price alone cannot tell you whether it is expensive or cheap; even with the same P/E, TSMC in a 40% revenue growth phase and TSMC with growth falling to single digits should not receive the same valuation.
A more effective valuation framework includes:
- Normalized EPS: Exclude one-time items such as VIS share gains.
- Forward P/E: Use next-twelve-month or 2027 consensus estimates, not just past profits.
- Earnings revisions: Are analyst EPS forecasts being raised or cut?
- Free cash flow yield: Check how much cash truly remains after heavy CapEx.
- Growth versus valuation: Can EPS growth support the current multiple?
- Risk premium: Are overseas costs, customer concentration, and Taiwan Strait scenarios already reflected in the price?
Stock returns roughly come from “earnings growth + valuation multiple change.” When earnings grow 30% and the P/E also expands from 20x to 35x, part of the gain comes from more fragile multiple expansion. In the future, even if the company keeps growing, if the market compresses the P/E from 35x back to 25x, the stock price can still fall.
13. How Does TSM Relate to AI Servers, Power, and Foundry Competition?
The AI supply chain cannot be viewed through one company alone.
Server orders can verify whether chip demand is actually being delivered downstream. When studying What Is DELL/USDT?, focus on AI server backlog, shipments, and customer deployment speed: rising server demand usually increases demand for GPUs, CPUs, networking chips, advanced nodes, and packaging, but Dell rising does not mechanically mean TSM must rise.
Power is the constraint at the other end. Studying the data center power logic represented by What Is XBE/USDT? can help determine whether AI projects can actually come online. If chips have been delivered but power, cooling, or grid connection is insufficient, deployment schedules can be delayed.
Foundry competition requires comparing pure-play foundry and IDM models. Through What Is XINTW/USDT?, investors can further understand that Intel may use TSMC capacity while also developing its own foundry. Intel product success is not necessarily entirely bad for TSMC, but if Intel Foundry makes substantive progress in advanced nodes, yield, and external customers, long-term competitive intensity will increase.
14. How Should Taiwan Strait Risk Be Incorporated into Valuation?
Geopolitical risk should be treated as scenario analysis, not as arbitrary predictions about the timing of specific events.
Investors can assess it across five layers:
- Operational risk: Can production, power, personnel, and equipment continue to operate?
- Logistics risk: Can raw materials, components, and finished goods be transported?
- Customer behavior: Will customers demand more overseas capacity or second-source suppliers?
- Cost of capital: Will the market demand a higher risk premium, thereby lowering valuation multiples?
- Mitigation: How much concentration can U.S., Japanese, and European capacity reduce, and at what margin cost?
Overseas expansion can reduce some risk, but it cannot replicate Taiwan’s complete R&D, talent, and supply chain cluster in the short term. A reasonable approach is to use different risk premiums in Bull, Base, and Bear valuations, rather than assuming risk is zero or asserting that conflict will necessarily occur at a certain time.
15. TSM Price Prediction: Use Bull, Base, and Bear Cases Instead of False Precision
Investors can refer to TSM price prediction to observe market trends, but truly reusable forecasts should be condition-based.
Bull Case: AI, 2nm, and Packaging Triple Growth
This requires hyperscaler AI CapEx to remain high-growth, HPC revenue to stay strong, 2nm mix to rise smoothly, CoWoS and SoIC expansion to be absorbed by real orders, gross margin to recover after the ramp, and overseas fabs to improve utilization as planned.
In this scenario, EPS could continue to be revised upward, and TSMC could continue to receive a valuation above that of a traditional cyclical foundry. But if the market has already priced in most of the growth, upside may still be limited even if fundamentals are very good.
Base Case: Revenue Normalizes, but Earnings Continue to Grow
AI demand continues to expand, but revenue growth gradually falls from above 40%; 2nm adds revenue while depreciation and overseas fabs keep gross margin slightly below peak. The company maintains technology leadership and high profitability, but stock returns increasingly depend on the valuation at purchase.
Bear Case: Demand, Margin, and Valuation Contract Together
Hyperscalers cut CapEx, AI chip inventory rises, 2nm customer ramp is below expectations, CoWoS supply exceeds demand, or overseas costs significantly exceed budget—all of these could lower earnings expectations. If this happens at a high valuation stage, EPS downgrades and P/E compression can create a “double hit.”
Fixed 2030 target prices easily create false precision. A better method is to update revenue, normalized EPS, gross margin, CapEx efficiency, and a reasonable P/E range every quarter.
16. When Should You Admit the TSM Bull Thesis Has Broken?
The following signals are not ordinary stock price volatility, but may represent a change in the investment thesis:
- Monthly revenue is consistently and significantly below the implied threshold from quarterly guidance.
- HPC revenue growth and mix decline persistently, not just due to one quarter’s product fluctuation.
- 2nm mass production, yield, or major customer adoption is repeatedly delayed.
- Hyperscalers repeatedly cut AI CapEx or delay data centers.
- Gross margin misses company guidance repeatedly and cannot be explained by planned ramp.
- CapEx rises, but advanced-node utilization and free cash flow keep falling.
- AI customer inventory days rise sharply, and order cancellations or delays increase.
- 2027 revenue and EPS estimates are repeatedly cut.
- HIBT TSM trades persistently far from the ADR reference price, or liquidity deteriorates sharply.
“AI will still grow long term” cannot be a reason to ignore short- and medium-term invalidation signals.
17. Do BTC and ETH Affect TSM/USDT?
TSMC wafer orders are mainly determined by semiconductor and AI demand. A BTC rally does not directly increase TSMC’s profit. But TSM/USDT trades on a crypto platform, so risk appetite, stablecoin liquidity, and deleveraging cycles reflected in BTC price prediction may affect token volume, bid-ask spreads, and short-term premiums or discounts.
ETH also has no direct causal relationship with TSMC revenue. However, ETH price prediction and the Ethereum ecosystem can serve as background indicators for RWA, programmable securities, and on-chain capital market activity. The current HIBT TSM is deployed on Robinhood Chain, not Ethereum mainnet, so “tokenized stock” cannot automatically be equated with “ERC-20.”
The conclusion is: BTC and ETH are trading environment variables for TSM/USDT. TSMC earnings, 2nm, HPC, and advanced packaging are the underlying fundamental variables.
18. Why Can TSM/USDT Briefly Trade at a Different Price from NYSE TSM?
Traditional ADRs and tokens differ in trading venue, hours, participants, and market-making depth. When the U.S. market is closed, on weekends, after major news, or when HIBT liquidity is insufficient, TSM/USDT may show a temporary premium or discount.
The following formula can be used to build a TSM Premium Tracker:
Premium/Discount Rate = (HIBT TSM/USDT Price - NYSE TSM Reference Price) ÷ NYSE TSM Reference Price × 100%
For example, if the ADR reference price is US$418 and TSM/USDT is 426 USDT, ignoring any USDT/USD deviation for the moment, the premium is about 1.91%. If the token quotes 410, the discount is about 1.91%.
This indicator should be calculated using the same timestamp, while also checking:
- Whether NYSE is open;
- Whether the ADR uses real-time, closing, or after-hours price;
- Whether USDT is close to US$1;
- HIBT order book depth and estimated slippage;
- Whether issuance or market-making mechanisms allow arbitrageurs to narrow deviations;
- Whether company earnings, monthly revenue, or AI industry news has just been released.
Price divergence does not automatically constitute risk-free arbitrage. If ordinary users cannot directly subscribe to and redeem tokens, deviations may persist; trading fees, on-chain fees, market-making limits, and reopening gaps can also erode the theoretical spread.
19. TSM Investment Strategy: Short-Term, Swing, and Long-Term Investors Should Watch Different Metrics
Short-Term Trading
The short-term focus is events and pricing gaps, including monthly revenue, earnings, NVIDIA and large cloud provider CapEx, TSM ADR pre-market and after-hours moves, TSM/USDT volume, and premium/discount. During the new listing stage, limit orders should be prioritized to avoid excessive slippage from market orders when the order book is thin.
Medium-Term Trend
The medium term should track HPC revenue, 2nm mix, CoWoS capacity, gross margin guidance, and EPS revisions. If revenue growth, normalized profit, and earnings expectations rise together, the fundamental credibility of the trend is higher than that of a simple price breakout.
Long-Term Allocation
The long-term thesis is whether TSMC can maintain combined leadership in advanced nodes, manufacturing, packaging, and customer trust, and convert huge CapEx into sustainable free cash flow. Long-term investors still need valuation discipline, rather than interpreting “core AI infrastructure asset” as meaning any price is acceptable.
Scaling In
Investors can first establish a tracking position, reassess after earnings, the 2nm ramp, or a pullback, and then decide whether to add. The purpose of scaling in is not to guarantee a lower cost, but to leave room to adjust to new information. Position size should be determined by maximum tolerable loss and portfolio concentration, not by a single day’s gain.
20. TSM’s 14 Biggest Risks
- AI CapEx risk: Cloud service providers’ investment growth may slow.
- Customer concentration risk: A few large customers’ product cycles have a significant impact.
- 2nm execution risk: Yield, mass production, or customer adoption falls below plan.
- Advanced packaging risk: Expansion pace mismatches real demand.
- CapEx risk: Returns on investments above US$60 billion are insufficient.
- Gross margin risk: New-node depreciation and start-up costs are higher than expected.
- Overcapacity risk: Utilization falls after demand cools.
- Competition risk: Samsung Foundry and Intel Foundry make breakthroughs.
- Geopolitical risk: Concentrated production in Taiwan creates a tail scenario.
- Overseas execution risk: U.S., Japanese, and European fab costs and timelines exceed expectations.
- Currency risk: USD/NT dollar changes affect reported revenue and margins.
- Valuation risk: The stock price has already priced in an AI supercycle.
- Token product risk: Disclosure on issuance, custody, redemption, and holder rights is insufficient.
- Liquidity and premium/discount risk: HIBT market depth is not the same as NYSE ADR market depth.
21. Final 15-Point Checklist Before Investing in TSM
Before placing an order, complete the following checks in order:
- NYSE TSM ADR real-time price: Confirm the underlying reference.
- HIBT TSM/USDT price: Confirm the token quote.
- Premium/Discount: Determine whether you are paying an extra premium.
- HIBT volume and order book: Judge actual entry and exit ability.
- Latest monthly revenue: Verify whether growth continues.
- HPC revenue and mix: Observe AI-driven strength.
- 2nm revenue share: Confirm new-node ramp.
- 3nm and advanced-node mix: Confirm technology mix.
- Gross margin: Judge growth quality.
- Operating margin: Reduce interference from one-time gains.
- CapEx: Observe investment intensity.
- CoWoS and advanced packaging capacity: Verify back-end bottlenecks.
- Overseas fab gross margin dilution: Quantify globalization costs.
- Normalized forward P/E: Judge how much growth is reflected in the price.
- EPS estimate revisions: Confirm the direction of market expectations.
The five most worth tracking continuously are: HPC growth, 2nm ramp, gross margin, CapEx efficiency, and valuation.
22. Is TSM Worth Investing In? Use a 9-Factor Framework Instead of a Simple Conclusion
The judgment can be summarized as the HIBT TSM 9-Factor Framework:
- AI/HPC Demand: Is demand continuing to exceed expectations?
- Advanced Node Mix: Are 2nm and 3nm shares rising?
- Advanced Packaging: Can CoWoS and SoIC continue to ramp?
- Revenue Growth: Are monthly and quarterly revenue meeting guidance?
- Gross Margin: Is growth remaining high quality?
- CapEx Efficiency: Is new investment generating enough revenue and cash flow?
- Overseas Fab Execution: Are geographic diversification costs controllable?
- Valuation: Has the market already priced in overly optimistic assumptions?
- TSM Wrapper Risk: Are token issuance, rights, liquidity, and premium/discount acceptable?
If the first seven factors are strong, valuation is reasonable, and the token deviation is small, TSM may offer a more convincing risk-reward. If the company is excellent but valuation is extremely high, or the token has a clear premium and opaque structure, waiting may also be an effective strategy.
23. FAQ: Common Questions About TSM/USDT and Investing in TSMC
What is TSM/USDT?
TSM/USDT is the Taiwan Semiconductor Manufacturing · Robinhood Token trading pair on HIBT, quoted in USDT and running on Robinhood Chain. It is linked to TSMC stock value, but it is not the TSM ADR itself on the New York Stock Exchange.
Is TSM TSMC stock?
TSM is also TSMC’s ADR ticker on the New York Stock Exchange, but TSM in the HIBT trading pair refers to a Robinhood Token. The same ticker does not prove that both have exactly the same legal rights.
What is the difference between TSMON, TSMB, and TSM?
All three may reference TSMC, but they belong to different tokenized product systems, and their issuance or branding, contracts, networks, redemption, and rights arrangements may differ. Investors must rely on specific product documents and contracts.
Does buying TSM Token mean owning TSMC stock?
It cannot be directly equated. It may provide economic price exposure close to the TSM ADR, but whether it carries dividends, voting, redemption, or bankruptcy claims must be confirmed by the issuer’s legal documents.
Why does TSMC benefit from AI?
AI accelerators, CPUs, in-house ASICs, and networking chips use advanced nodes heavily and require advanced packaging such as CoWoS. TSMC covers both manufacturing and packaging bottlenecks, so it can benefit from expansion by multiple AI hardware winners.
Why does HPC already account for 66% of TSMC revenue?
Second-quarter HPC revenue grew 20% quarter over quarter, reflecting strong demand for AI accelerators, server CPUs, in-house chips, and networking compute. But HPC is not entirely generative AI revenue.
Has TSMC’s 2nm already entered mass production?
In the second quarter of 2026, 2nm already contributed 3% of wafer revenue, indicating it has entered the revenue ramp stage. The key going forward is share, yield, customer adoption, and the pace of gross margin improvement.
Why does 2nm growth temporarily lower gross margin?
New processes typically have higher depreciation, start-up costs, and lower initial yields. TSMC expects the rapid 2nm ramp to dilute third-quarter gross margin by about 3–4 percentage points, which is not inconsistent with the long-term growth thesis.
Why is CoWoS important?
CoWoS connects AI logic chips, HBM, and interposers at high density. Without sufficient packaging capacity, manufactured chips cannot form deployable AI computing modules.
How much is TSMC expected to grow revenue in 2026?
Management said on the second-quarter earnings call that full-year 2026 U.S. dollar revenue is expected to grow slightly above 40% year over year. This forward-looking judgment remains subject to market demand, exchange rates, and execution.
Why did TSMC raise CapEx to more than US$60 billion?
Mainly to support multi-year demand for advanced nodes, specialty nodes, and advanced packaging. High CapEx reflects strong customer signals and also increases future depreciation and overcapacity risk.
Will U.S. fabs drag down TSMC’s profit?
Overseas fabs currently dilute gross margin, but they also diversify geopolitical concentration and move closer to customers. Investors need to compare the value of lower long-term risk with additional manufacturing costs.
Is TSM expensive now?
You cannot judge by stock price or static P/E alone. Consider normalized EPS, future growth, free cash flow, earnings estimate revisions, geopolitical risk premium, and TSM/USDT premium/discount versus the ADR.
Is TSM worth holding long term?
The long-term thesis depends on whether advanced node and packaging leadership continues, whether AI demand is real, whether CapEx returns are sufficient, and whether the purchase valuation is reasonable. Token holders also bear additional product structure and liquidity risk.
Which indicators should TSM price prediction focus on?
At minimum, look at revenue, normalized EPS, HPC growth, 2nm and 3nm mix, gross margin, CapEx, advanced packaging utilization, forward P/E, and TSM/USDT premium/discount—not just extrapolate from a price chart.
24. Conclusion: Is TSM Worth Buying? The Key Is Whether Growth Can Continue to Beat Expectations
From a fundamental perspective, TSMC in 2026 is still in a very strong growth phase. Second-quarter U.S. dollar revenue was US$40.2 billion, up 33.7% year over year; HPC contributed 66% of revenue, and 2nm contributed 3% of wafer revenue for the first time. By August, cumulative year-to-date revenue was still up 39.3% year over year, and management expects full-year U.S. dollar revenue growth slightly above 40%.
These data prove that AI has entered TSMC’s revenue and income statement, but they do not prove that any price is reasonable. Future returns still depend on three questions:
First, can AI/HPC, 2nm, and advanced packaging continue to grow faster than market expectations?
Second, can US$60–64 billion in CapEx, initial 2nm costs, and overseas fabs convert into revenue and free cash flow without permanently damaging gross margin?
Third, how much of the AI supercycle has already been priced into the current TSM ADR valuation and HIBT TSM/USDT premium?
Therefore, the most reasonable framework for analyzing TSM is:
Business Quality × Earnings Growth × Valuation × Tokenized Product Risk
Not “AI is great, so TSMC must rise.” First verify product rights, then analyze fundamentals, and finally compare valuation and price deviation. That is the correct order for researching TSM/USDT.